January
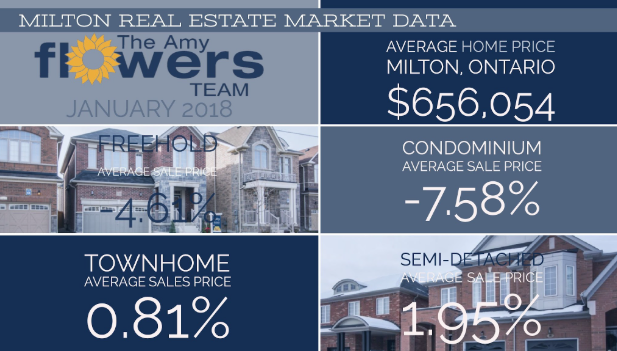
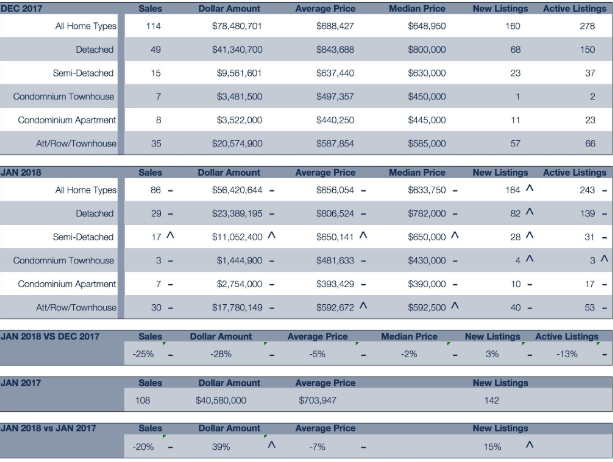
Milton began 2018 with 98 residential sales and an average sale price of $688,760. Sales volume was down 21% compared with January 2017, while the average price was 7% lower. Homes spent an average of 36 days on the market, giving buyers more time and choice than they had experienced one year earlier.
February
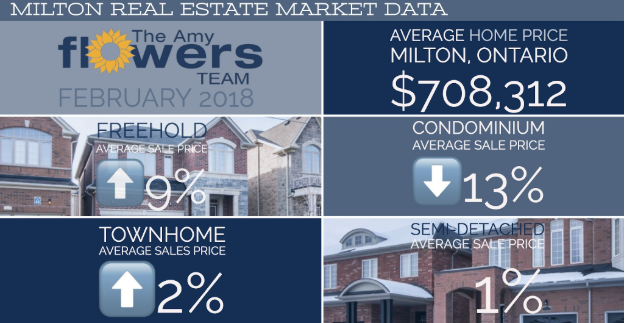
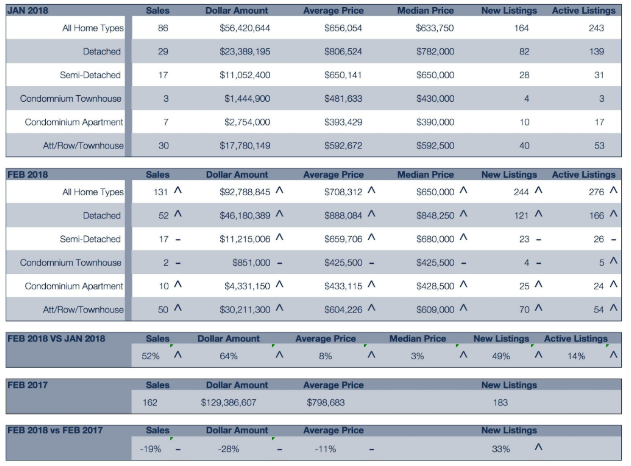
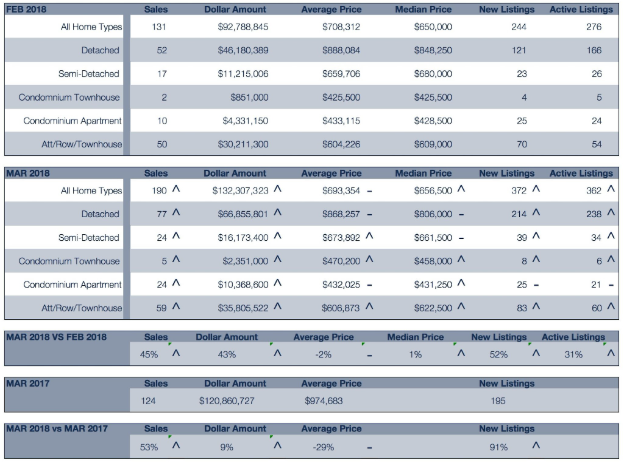
Market activity increased in February, with 132 residential sales and an average sale price of $725,731. Although sales remained 29% below February 2017, the average price rose 5% from January. Inventory sat at approximately 2.7 months, while the average home took 30 days to sell.
March
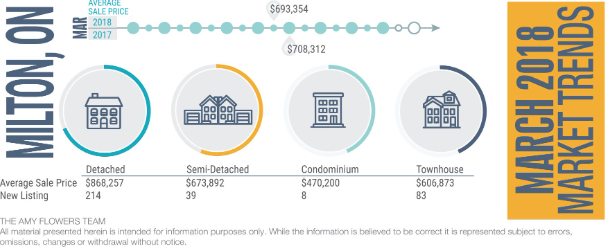
The March report captured Milton’s transition into the spring real estate market. As more buyers and sellers entered the market, pricing, available inventory and the relationship between new listings and completed sales became increasingly important indicators of local conditions.
April
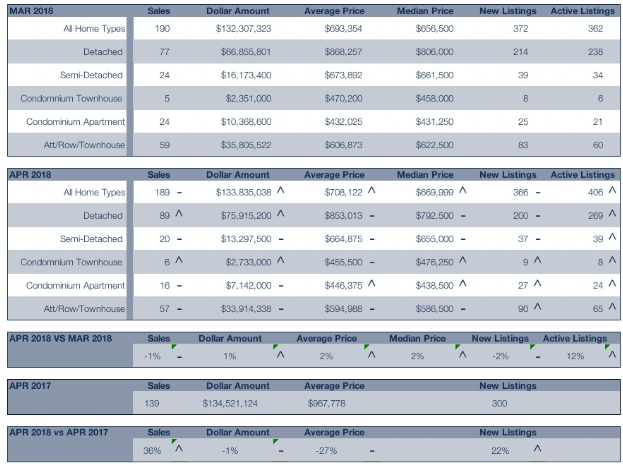
April provided a clearer picture of Milton’s spring market. The month’s data showed how buyer demand responded to new inventory and how quickly properly priced homes moved as the traditionally busier selling season developed.
May
An original Milton market report or infographic for May 2018 was not available in the archived material. This section remains to provide a complete month-by-month timeline without estimating or inventing historical figures.
June
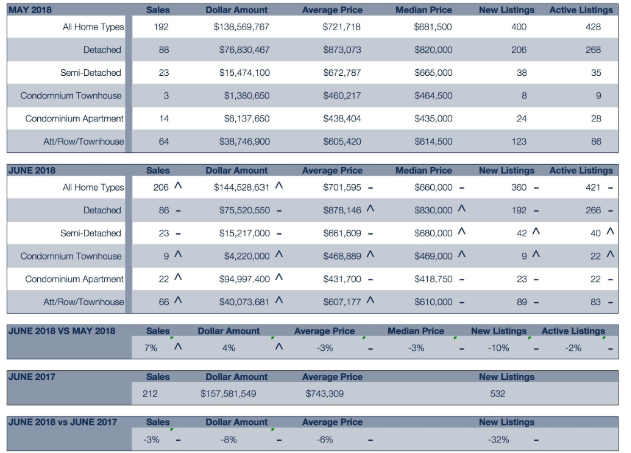
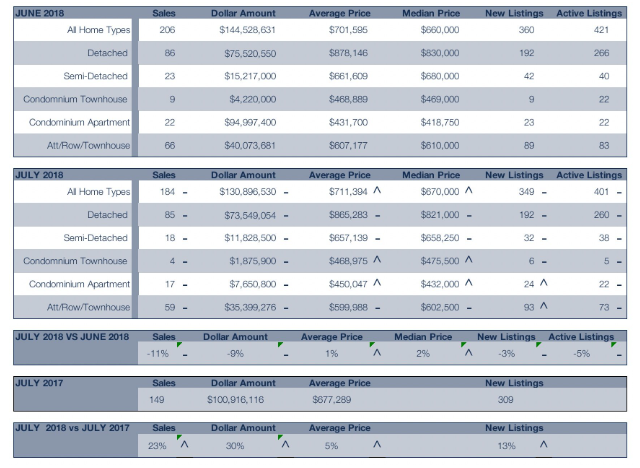
By June, Milton’s spring market was moving toward the summer period. The archived statistics provide a useful comparison of sales activity, prices, inventory and days on market as buyers gained more information and choice heading into the second half of the year.
July
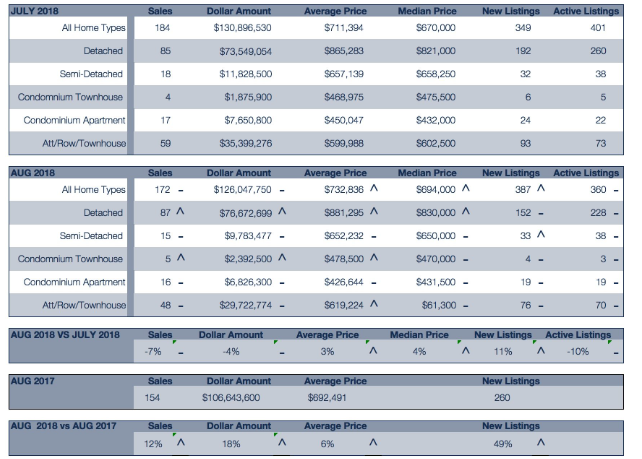
July’s data captured the Milton market during the summer, when sales and listing activity can change as families travel and prepare for the approaching school year. The figures offer historical context for how local homes performed outside the busiest part of the spring market.
August
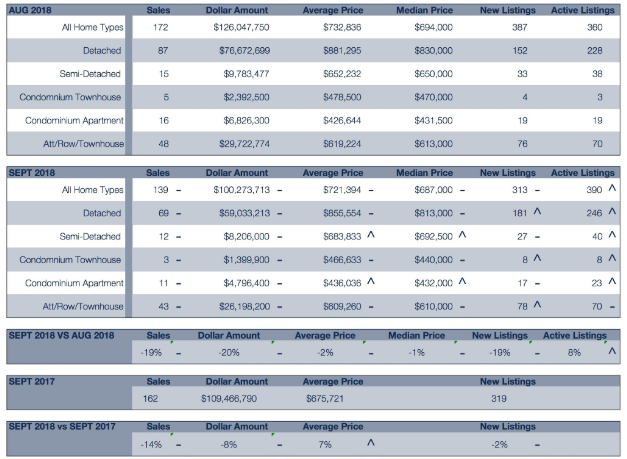
The average Milton home price increased in August. The month’s report provides additional context on how prices, sales activity and available inventory changed as the summer market moved toward the traditionally more active fall period.
September
September marked the beginning of Milton’s fall real estate market. The archived figures show how buyer demand and listing activity responded after the summer, giving buyers and sellers a clearer view of market conditions heading into the final quarter of 2018.
October
An original Milton market report or infographic for October 2018 was not available in the archived material. The month remains included in this report so the annual timeline is complete without presenting unsupported statistics.
November
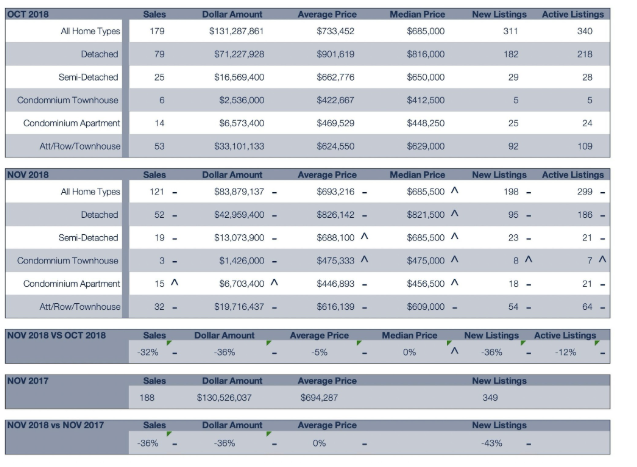
November’s report captured Milton’s late-fall market as activity began moving toward the typically quieter holiday season. At this point in the year, accurate pricing and an understanding of current competition were especially important for sellers, while buyers could assess homes with less seasonal pressure.
December
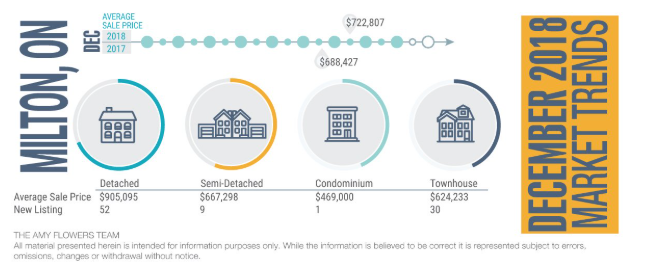
Milton recorded 91 residential sales in December, representing a 20% decrease from December 2017. The average sale price reached $722,807, up 5% year over year and 4% from November.
Inventory was about 2.5 months of supply, while homes sold in an average of 28 days. Buyers had a reasonable selection of properties, but appropriately priced homes could still attract interest. The limited rental supply also created potential opportunities for buyers considering an investment property or a home with a rentable secondary living space.
Understanding the Sales-to-New-Listings Ratio
The sales-to-new-listings ratio compares the number of homes sold during a given period with the number of new listings entering the market.
A higher ratio generally indicates stronger competition among buyers and conditions that favour sellers. A lower ratio suggests buyers have more properties to choose from and may have greater negotiating power. A balanced market falls between these conditions.
Interest rates, employment, population growth, lending requirements, buyer confidence and available inventory can all influence the direction of the Milton real estate market.
2018 Milton Real Estate Market Summary
The 2018 Milton real estate market gave buyers more time and choice than the highly competitive conditions experienced at the beginning of 2017. However, activity and prices continued to vary from month to month.
The year demonstrates why a single headline or average price does not tell the entire story. Sales volume, inventory, days on market, property type and neighbourhood-level demand all help determine what market conditions mean for an individual buyer or seller.